Synopsis: When you need to analyze HTTP traffic, use Fiddler, my favorite debugging tool
I use Fiddler every day.
I debug/fix/tweak/troubleshoot/analyze various bits of software and web services throughout an average week. Most of the code is not of my making, while some of it I may have never seen before. Sometimes, I might not even know what the system is supposed to do when I get a notification indicating that it is not working properly. In these cases, my first line of debugging defense is Fiddler.
Sure, I eventually analyze logs and sometimes grab a copy of the source code to troubleshoot. However, almost invariably, the first thing I do is fire up Fiddler and access the system in question. Right away, it usually gives me clues signaling where to begin my investigation. Sometimes, I can even diagnose the issue without ever having to look elsewhere.
Below are my top reasons I love Fiddler.
1. Debugging Web Services
I find Fiddler particularly invaluable for debugging those hard-to-debug services and web services. Take a WCF (Windows Communication Foundation) web service for example. The easiest way to determine what is wrong with one of these web services is to look at the raw SOAP (Simple Object Access Protocol) requests and responses. How do you do that? A browser or debugger will not make these easily available. Fiddler to the rescue! To view the raw SOAP (Envelope, Headers and Body), I setup Fiddler as an HTTP proxy server for whatever WCF test-client I am using. Often, I just add it to my app.config or web.config file:
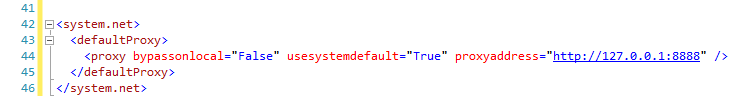
Add Fiddler as a Proxy
After Fiddler has been setup as a proxy server, all HTTP traffic between my WCF client and the WCF web service is available to my scrutiny.
2. Access to the Complete HTTP Request and Response
You get access to all the goodies that are difficult to view in a debugger, all in one place. Including:
- Request Headers
- Response Headers
- User-Agent strings
- Referers
- Cookies
3. Debugging Mobile Web Sites and Apps
Mobile debugging tools are not terribly robust and can be painful to use. While emulators and device simulators are much easier to use, they sometimes do not faithfully reproduce the environment you are trying to debug.
My solution is to enhance my mobile debugging capabilities with Fiddler so that I can see exactly what the device is sending to my server and exactly what the device is receiving in return. I do this by setting up Fiddler on my server and adding it as an HTTP proxy on the mobile device. This routes all the device traffic though Fiddler, allowing me to view it all.
4. Remote (time and space) Debugging
Every so often, I run into a situation where an issue is occurring on a client’s machine, but I cannot reproduce it locally. Similarly, I sometimes don’t have physical access to a system or a user’s browser (e.g. behind a firewall, etc.).
If I don’t have any visibility into the problem, any attempt to fix the issue is just guesswork. That’s where Fiddler comes in handy. With Fiddler, you can instruct an end-user to log all HTTP traffic in a session file (.saz) by having them save the session. Basically, they can provide a snapshot of the HTTP traffic during a given time-period. This allows me to troubleshoot remotely without physical access and/or being available during the particular time-frame in which the issue is occurring.
5. Honorable Mention: Security Testing and the Ability to Decrypt HTTPS traffic
…To Be Continued with JSLint, ReSharper, MinMerge and NotePad++
